Simple Prediction on Workout History
July 5, 2026
I have been a gymgoer on and off. I consider myself to be what kids nowadays call “mid” when it comes to making progress. I recently downloaded a couple of years of workout logs from my workout tracker app. During a sweltering heat wave, I thought I should spend a few hours trying to find any insights about my gym habits before the Fourth of July fireworks start.
Note that this blog is very basic both in technical depth and conclusions reached, but starting small is helping my doom-scrolling brain to heal.
Data Exploration
This can easily be done by loading the CSV data in visualization software, but why automate all the fun when we can deal with Pandas? I will link the full notebook below, but a few lines of code painted an embarrassing picture of inconsistency.
import pandas as pd
import matplotlib.pyplot as plt

df = pd.read_csv(CSV_PATH, parse_dates=["Date"])
# Get individual days of workout
days = df["Date"].dt.normalize().drop_duplicates()
# Get individual months with count of number of workout days, ex: 2025-07: 10
per_month = days.groupby(days.dt.to_period("M")).size()
...
plt.show()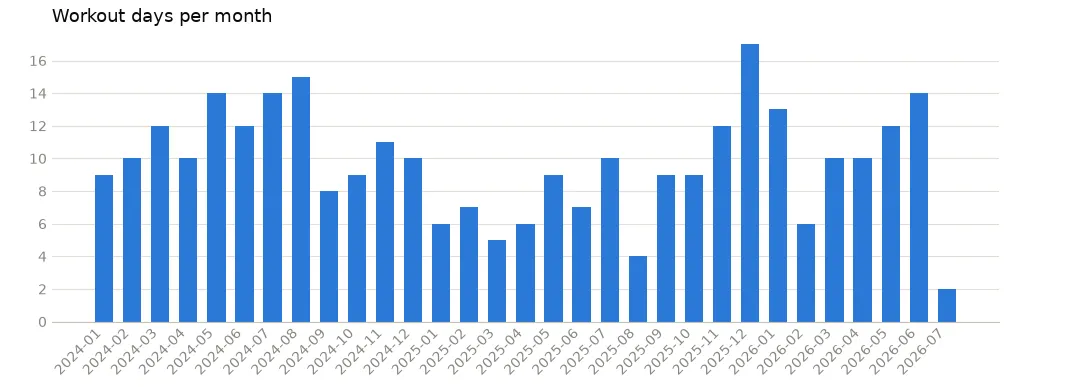
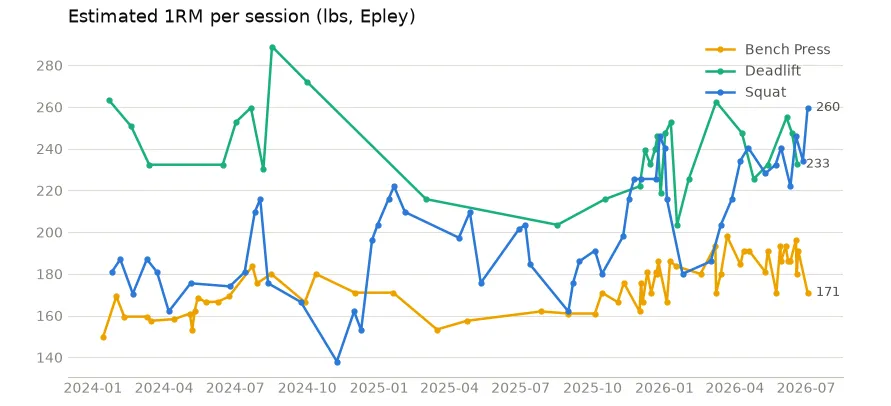
This made me wonder why 2025 was such an inconsistent year. I did go through some life events and a job change. Nonetheless, the data showed a clear impact of inconsistency on performance.
Here’s the Epley 1 rep max (1RM) progression for the three big lifts — Squat, Bench Press, and Deadlift.
Simple Prediction
Since the data is sparse, I wanted to use prediction to confirm something obvious. I think predicting things like performance on a certain exercise would be interesting, but that would require more consistency as well as other factors not reflected in the data — sleep, nutrition, etc.
To start off with, I wanted to predict given historical data, how likely I am to go to the gym on a particular day.
After some more basic exploration, here are the features I settled on:
- dayOfWeek — just Mon–Sun
- isWeekend
- month
- wentYesterday
- freq7 — share of the last 7 days I went
- freq30 — share of the last 30 days I went
- daysSinceLast — days since the last time I went
Since the dataset is small (~900 days of tracking, 717 used for training) and I wanted probabilities for a binary classification problem, I decided to use sklearn’s LogisticRegression. If you are not familiar with logistic regression, it’s just a weighted sum pushed through a squashing function.
score = w₁·isWeekend + w₂·freq30 + w₃·freq7 + ... + b
Then a sigmoid is used to convert the raw score into a probability (between 0 and 1):
probability = 1 / (1 + e^(-score))
Here’s the Python code snippet:
from sklearn.linear_model import LogisticRegression
from sklearn.metrics import roc_auc_score, accuracy_score

model = LogisticRegression(max_iter=1000)
model.fit(train[FEATURES], train["wentToGym"])
prob = model.predict_proba(test[FEATURES])[:, 1]
...
# you can get AUC and accuracy like
round(roc_auc_score(test["wentToGym"], baselineProb), 3)
Outcome
These are the model outcomes:
| Predictor | AUC | Accuracy |
|---|---|---|
| Always predict “no gym” | — | 0.638 |
| Baseline (weekday rate) | 0.680 | 0.751 |
| Logistic regression | 0.714 | 0.741 |
- Always predict “no gym” — mr.obvious, since I didn’t go most days. A naive model always predicting no-go would be right 63.8% of the time.
- Baseline (weekday rate) — historical attendance rate for each day of the week (ex: “he goes 60% of Saturdays, 25% of Tuesdays”).
- Logistic regression — the full model: the weekday plus recent history (streaks, frequency, rest days).
The model beats the baseline on AUC but not on accuracy — accuracy at a 0.5 cutoff is a blunt metric on an imbalanced problem, so AUC is the fair comparison here.
And the learned coefficients. The features aren’t scaled, so only the signs are meaningful:
| Feature | Coefficient | Reading |
|---|---|---|
| isWeekend | +2.030 | I’m very much a weekend lifter |
| freq30 | +1.075 | A consistent month builds momentum |
| freq7 | −0.565 | This is likely due to rest days after a heavy week, interesting |
| wentYesterday | +0.190 | Back-to-back days, slightly |
| dayOfWeek | −0.184 | Looks like just noise |
| daysSinceLast | −0.086 | Absence breeds (little) absence |
| month | +0.039 | No real seasonality, which is surprising to me |
Overall, this finding reinforced what I already knew — I need to be more consistent. However, there were some small surprising predictions like freq7, and I also got to use sklearn for the first time since my SageMaker days.